What Australian studies found about street trees and house prices
A study by study account of what Australian sale price research found for street trees and canopy near a house, in Perth, Brisbane and Sydney, with each document's method. It reports what two councils say on who plants the verge, and gives Queensland grower counts and trade medians for species on Brisbane City Council's street tree table.
Updated 17 October 2026. Figures are what the live au.hortosapp.com price and plant pages printed.
On this page
- Quick facts
- Perth, Brisbane and Sydney: what each document measured
- Public land beside the house, and the house lot itself
- Who plants and prunes a street tree
- Brisbane's street tree species at trade in Queensland
- What the sale price studies and the trade figures leave unmeasured
- What to watch for
- Getting it right
- A word of caution
- Sources
A property writer is told that a leafy street lifts house prices and wants to know where in Australia that was measured, and what was found. In Australian studies of Perth, Brisbane and Sydney sales, dated 2012 to 2017, higher prices went with trees on public land near a house. In the Perth and Brisbane papers, canopy on the house lot showed no effect or a lower price. The exception is Brisbane, where a 2016 University of Queensland paper found a higher price with tree cover under 20 per cent of the lot.
The findings come from three papers on Perth and a Brisbane study issued as a University of Queensland discussion paper in 2016 and in the journal Ecological Economics in 2017. A 2017 report from the consulting firm AECOM covers Sydney. Brisbane City Council and the City of Stirling are reported on their own street trees. HortOS, a free directory of Australian wholesale plant growers with their published availability and trade prices, adds who lists Brisbane's street tree species. This page is not a valuation and promises no return.
Quick facts
| A street tree in Perth | A 2016 University of Queensland discussion paper reports the result of a 2013 Perth, Western Australia, article in Landscape and Urban Planning as a 4.27 per cent premium for one broad-leaved tree on the street frontage. |
|---|---|
| Footpath canopy in Brisbane | The abstract of a 2017 article in Ecological Economics reports buyers willing to pay 3.73 per cent more for Brisbane, Queensland, houses where footpaths within 100 m had the target level of 50 per cent tree cover. Its model used 2,299 house sales in 52 Brisbane suburbs. |
| Street canopy in Sydney | A 2017 report from the consulting firm AECOM found that 10 per cent more canopy went with $33,152 more on property prices in Willoughby, $55,000 in Blacktown and $60,761 in Annandale, New South Wales. It used sales from September 2012 to September 2016. |
| Canopy on the house lot | The abstract of a 2014 article in the Australian Journal of Agricultural and Resource Economics reports that canopy on the lot lowered value among 5,606 detached Perth houses sold in 2009. In Brisbane it went with a lower price unless it covered under 20 per cent of the lot (University of Queensland discussion paper, 2016). |
| Who plants the verge | Brisbane City Council (Queensland, 2026) says planting a tree on council land is not something it permits residents to do, and that a resident who wants a verge tree asks the council for one. |
| A Brisbane street tree on growers' lists | Australian tulipwood, a species on Brisbane City Council's street tree table, was listed in any size by 30 Queensland growers on HortOS. |
Perth, Brisbane and Sydney: what each document measured
The papers call their method hedonic price modelling, and this guide calls it a sale price model. The University of Queensland discussion paper (Brisbane, 2016) describes it as showing what homebuyers are willing to pay for a small change in the condition, amount or closeness of tree canopy, with a house's other attributes allowed for. The method matters to the answer. In the abstract of the 2012 Perth conference paper, the estimate for street tree cover from the spatial model was half the one from an ordinary model.
The table sets out 5 documents from three cities, each with its method, its main finding and what it reports for trees on the house lot or states as a limit. The two Brisbane rows are one study in two documents. This guide takes the headline figures from the published 2017 abstract and uses the 2016 discussion paper only for what the abstract does not give. The Perth rows and the 2017 Brisbane row are written from abstracts. The two Perth rows, a 2012 conference paper and a 2014 journal article, both set canopy on public land against canopy on the house lot. Their abstracts do not say whether the two draw on the same sales, so this guide does not count them as two separate confirmations.
| Study | Method and sample | What it found | Trees on the house lot, and stated limits |
|---|---|---|---|
| Perth, Western Australia. Paper to the agricultural economics society's 2012 conference in Fremantle | Sale price model with spatial effects on sales of detached houses | A 10% rise in verge tree cover above the 19.66% median went with about AU$3,250 more on a AU$765,000 median house | No effect was found for canopy on the house lot. A model without the spatial terms gave an estimate twice the size |
| Perth, Western Australia. Article in the agricultural and resource economics society's journal, 2014 | Spatial sale price model on 5,606 detached houses sold in 2009 | Canopy on public land beside the house raised its value | Canopy on the house lot, and on a neighbour's lot within 20 m of the boundary, lowered it |
| Brisbane, Queensland. Journal article, Ecological Economics, 2017 | Spatial sale price model on 2,299 house sales at 80 sample sites in 52 suburbs | Buyers were willing to pay 3.73% more where footpath canopy within 100 m of a house was at the 50% level targeted for 2031 | Detached houses only. Units, apartments and rents were left out, the study's 2016 discussion paper says |
| Brisbane, Queensland. University of Queensland discussion paper 563, 2016 | Spatial sale price models on single house sales from 2008 to 2010 | No significant effect from canopy on the footpath directly in front, on footpaths within 30 m, or on neighbours' lots | Canopy on the house lot went with a lower price overall, and a higher one only where it covered less than 20% of the lot |
| Sydney, New South Wales. Consulting firm's report (AECOM), 2017 | Property sales in each of three suburbs from September 2012 to September 2016, restated in 2016 prices | Ten per cent more canopy went with $33,152 more in Willoughby, $55,000 in Blacktown and $60,761 in Annandale | The report notes that many things move prices and that it looked at canopy, price and temperature |
One more Perth document is reported in prose only. The abstract of a 2013 article in the journal Landscape and Urban Planning reports a spatial sale price model across 23 suburbs of metropolitan Perth, Western Australia. On that abstract's account (Perth, 2013), a broad-leaved tree on the verge put about AU$16,889 on the median price of a property. The Brisbane authors' 2016 paper reports that article's result as a 4.27 per cent premium for such a tree on the frontage. Both figures are reported for the same 2013 article and the same kind of tree, and this guide counts them as one finding.
The Sydney report (AECOM, New South Wales, 2017) describes its method in its own terms: it took property sales from September 2012 to September 2016 in Annandale, Blacktown and Willoughby, restated in 2016 prices. The report (Sydney, 2017) set the street tree canopy of each suburb against the value of similar kinds of property in the same area with similar services nearby. Its headline (AECOM, Sydney, 2017) is a conservative estimate that 10 per cent more leaf canopy on street trees could add an average of $50,000 to property values across the three suburbs.
Public land beside the house, and the house lot itself
The premiums in the table belong to trees on public land: the verge and public land next to the house in Perth, footpaths within 100 m in Brisbane (2017 abstract), and street tree canopy across a suburb in Sydney.
Brisbane and Perth differ on which street trees counted. The 2016 Brisbane paper found no significant effect from canopy on the footpath in front of a house, or on footpaths up to 30 m away. Its authors (Brisbane, 2016) contrast this with Perth, where they describe the effect of a street tree as greatest on the front footpath.
On the house lot the Perth and Brisbane documents point the other way. The abstract of the 2012 Perth paper reports no evidence that tree cover on the lot affected the sale price. The abstract of the 2013 Perth article reports no significant effect from broad-leaved trees inside the property boundary or next door, and none from palms wherever they stood. The abstract of the 2014 Perth article reports that canopy on the lot, and on the lot next door within 20 m of the boundary, lowered value. The 2012 and 2014 results, from the two Perth rows of the table, differ. In the 2016 Brisbane paper, canopy on the lot went with a lower price overall, and a higher one only where trees covered under 20 per cent of it. The paper puts that threshold eight percentage points below the average cover on lots in its Brisbane sample (2016).
The Brisbane authors (2016) suggest why canopy close to a house may count against it: perceived risk, lost sun or views, and the work of maintaining the trees. The Sydney report (AECOM, 2017) sets out a cost side for street trees too: damage to roads, footpaths and plumbing, and the trimming energy companies do to keep power lines clear. The guide to trees and shrubs for planting under power lines shows who lists trees and shrubs for those sites.
Who plants and prunes a street tree
The trees that carried a premium in these studies stand on public land, and the 2016 Brisbane paper says who looks after it. Like most local authorities in Australia, the 2016 paper says, Brisbane City Council is responsible for planning, planting, maintaining and protecting the trees on council land, street trees among them. The paper also reports the council's aim at the time (Brisbane, 2016): to lift shade over residential footpaths to 50 per cent by 2031, up from the 35 per cent measured in 2010. That is the level the 2017 article tested. In 2010, the 2016 paper says, street trees were 10 per cent of the tree canopy in Brisbane's residential suburbs, and private property held 63 per cent. The authors of the 2014 Perth article read their results as suggesting that council tree planting gives homeowners significant private benefits.
Brisbane City Council's own page (Queensland, 2026) says it does not let residents plant trees on council land, and that someone wanting a tree on the verge outside the house asks the council to plant it. The same page (Brisbane City Council, Queensland, 2026) says a property owner needs a permit for minor pruning of the street tree outside the property. It names the Natural Assets Local Law 2003 as the law protecting street and park trees (Brisbane City Council, Queensland, 2026). This guide reports the council's description of that law and no more.
The City of Stirling says (Western Australia, 2026) that it plants about 7,000 new trees a year across verges, reserves and natural areas, and that pruning a street tree is not permitted for residents. Brisbane City Council (Queensland, 2026) includes higher property values among the things street and park trees help to do, and the City of Stirling (Western Australia, 2026) says tree lined streets raise property values. Each statement is the council's own, made on its page named in Sources.
Brisbane's street tree species at trade in Queensland
Brisbane is where the footpath canopy study was done, and Brisbane City Council publishes a table of the street tree species it plants (Queensland, read 5 October 2026). The council says (Queensland, 2026) that it selects species for how well they suit six kinds of Brisbane landscape.
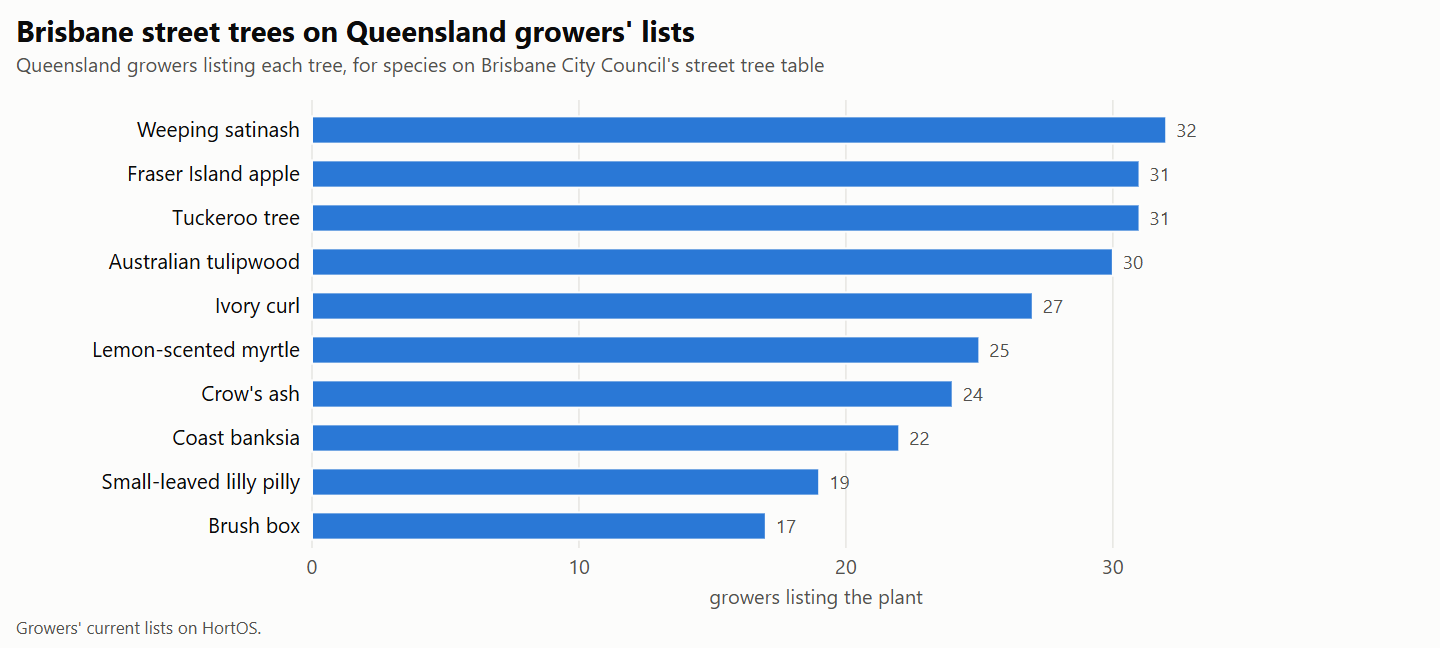
The table below shows 10 trees from the council's table, under the council's common names. Each row is one plant page on HortOS, the page under the council's botanical name. Each tree shown is a species of the council's table whose page shows a 45 litre bag priced by five or more growers. The test is applied to that one page, so the rows are not every tree of the council's that growers price in that size. The council's table holds 51 other entries that are not shown here.
Prices are medians across growers' current trade lists on HortOS: one price per grower, ex GST, freight not included, with the number of growers pricing each size in brackets. The count column is the growers in Queensland listing the tree in any size on that date. The median column takes in growers in any state pricing a 45 litre bag of that tree, so it is a national figure and not a Queensland price. The last column is the median among Queensland growers alone, shown where three or more of them price that size. Anyone can see the prices on HortOS, and only the trade can order. A count here is growers listing the plant, not how many plants exist or how well it suits a site.
| Plant | Growers listing it in Queensland | Size | Median (growers pricing) | Queensland median |
|---|---|---|---|---|
| Weeping satinash (Waterhousea floribunda) | 32 | 45 L | $105 (15) | $95 |
| Fraser Island apple (Acronychia imperforata) | 31 | 45 L | $105 (11) | $105 |
| Tuckeroo tree (Cupaniopsis anacardioides) | 31 | 45 L | $110 (16) | $100 |
| Australian tulipwood (Harpullia pendula) | 30 | 45 L | $104.50 (12) | $109 |
| Ivory curl (Buckinghamia celsissima) | 27 | 45 L | $93 (7) | $110 |
| Lemon-scented myrtle (Backhousia citriodora) | 25 | 45 L | $130 (11) | $130 |
| Crow's ash (Flindersia australis) | 24 | 45 L | $109 (5) | $101 |
| Coast banksia (Banksia integrifolia) | 22 | 45 L | $122.50 (8) | $125 |
| Small-leaved lilly pilly (Syzygium luehmannii) | 19 | 45 L | $100 (5) | $100 |
| Brush box (Lophostemon confertus) | 17 | 45 L | $110 (5) | Fewer than three growers |
Each median is for a tree in a 45 litre bag, and none is the cost of a planted street tree. Australian tulipwood is listed by 30 Queensland growers, and its median for a 45 litre bag rests on 12 growers across Australia. Brush box is listed by 17 Queensland growers, too few of whom price a 45 litre bag for a Queensland median.
A row counts one plant page. Where growers list a tree under a second form of its name, that page is not added in, so a row can undercount. A tree whose prices sit mostly on its other page can be absent from this table. The guide to street trees and canopy gives medians for larger bags, and the guide to what plants cost in 2026 explains what a trade price leaves out.
What the sale price studies and the trade figures leave unmeasured
No Australian sale price study of garden landscaping, as distinct from tree canopy, was read for this guide. Every finding above is about trees and canopy in an Australian city.
Each figure belongs to one city and one period. The 2014 Perth article used houses sold in 2009. The Brisbane study used sales from 2008 to 2010, its 2016 paper says, and the Sydney report (2017) used sales from September 2012 to September 2016. This guide gives no sale year for the 2012 and 2013 Perth papers, which it knows from their abstracts.
The models find what went with higher prices in past sales. The Brisbane authors (2016) call their result a caution against taking a result from one city as a measure of the benefit in another, even where country and climate are shared. They say not every characteristic of a house can be measured (Brisbane, 2016). Their model left out the size, condition and age of the street trees, and it left out units, apartments and rents (Brisbane, 2016).
HortOS shows who lists a tree and, where three or more growers price a size, a trade median for it. It does not show what a planted tree adds to a sale, and HortOS puts no value on a standing tree. The second table counts Queensland growers and takes its trees from Brisbane's species table only; its median column is national. Readers in Perth or Sydney can start from the Western Australia and New South Wales grower pages.
What to watch for
- Reading a street tree finding as a garden finding. The premiums reported are for trees on public land. On the house lot the Perth and Brisbane documents report no effect, a lower value, or in Brisbane a higher price only under 20 per cent cover (University of Queensland discussion paper, 2016).
- Carrying one city's figure to another. In Brisbane the front footpath showed no significant effect, while the Brisbane authors (2016) describe Perth's effect as greatest there.
- Counting the 2013 Perth result twice. The percentage the Brisbane authors report and the dollar figure in the abstract are reported for the same 2013 article and the same kind of tree.
- Leaving out what kind of document a figure comes from. Some are journal or conference papers known here from their abstracts, one is a university discussion paper, and one is a consulting firm's report. The Sydney report (AECOM, 2017) notes that many things move property prices.
- Setting a study figure against a trade median. One is an estimate from house sales in one city and period, and the other is the price of a tree in a bag. This guide makes no sum from the two.
Getting it right
- Name the document, the city and the year beside any figure taken from this page, and say whether it is a journal article, a discussion paper or a consulting report.
- Say where the tree stood: the verge, footpaths within 100 m, public land next to the house, or the house lot.
- For a tree on a verge or footpath, ask the council for the street. Brisbane City Council (Queensland, 2026) says a resident asks it to plant one. Ask which species the council plants in that street.
- Before pruning a street tree, ask the council. Brisbane City Council (Queensland, 2026) says the owner of a property needs a permit before minor pruning of the street tree outside it. The City of Stirling (Western Australia, 2026) says a resident is not permitted to prune a street tree.
- For a tree in the second table, open its price page from the table or from the price pages to see each size, its median and the growers pricing it on the day.
A word of caution
The findings on this page are those of the papers' authors and of AECOM, each for one city and one period. The 2016 Brisbane paper says that Brisbane City Council, like most local authorities in Australia, is responsible for the trees on its land, street trees included. Brisbane City Council (Queensland, 2026) and the City of Stirling (Western Australia, 2026) each set out what a resident may do to a street tree; for any other street, the body that looks after it is the one to ask. The HortOS counts and medians are what the plant and price pages printed, and the live pages change as growers update their lists.
Sources
- University of Western Australia Research Repository, The effect of street trees on property value in Perth, Western Australia (Landscape and Urban Planning, 2013): abstract of the verge tree article.
- Australian Agricultural and Resource Economics Society, 2012 Conference, The importance of tree cover and neighbourhood parks in determining urban property values: IDEAS/RePEc abstract on Perth verge canopy.
- Australian Journal of Agricultural and Resource Economics (2014), Valuing public and private urban tree canopy cover: IDEAS/RePEc abstract, public and private canopy.
- Ecological Economics, volume 134 (2017), Evaluating Revealed Preferences for Street Tree Cover Targets: IDEAS/RePEc abstract of the Brisbane article.
- University of Queensland School of Economics, Discussion Paper 563 (2016), Property value returns on investment in street trees: Brisbane method, results and limits.
- AECOM, Green Infrastructure: A vital step to Brilliant Australian cities (2017): Sydney street canopy and property values.
- Brisbane City Council, Brisbane trees: street tree species table and tree rules. © Brisbane City Council 2016, used under the Creative Commons Attribution 4.0 licence.
- City of Stirling, Planting programs and tree maintenance: verge tree planting and street tree pruning.
More guides
Trees and shrubs for planting near powerlines, and who lists them
What Australian network operators, a regulator and a state department publish about trees near overhead powerlines, set side by side with each body's state and date. Two plant tables then count the growers listing the plants named on Evoenergy's list for the ACT and in a Queensland council's table, with a trade median for the plants enough growers price.

Street Trees and Canopy: What Advanced Stock Costs and Who Holds It
The advanced-tree story from the HortOS Plant Price Index as a standing page: the trees the trade grows for streets and parks, the farm-gate median at 45, 100 and 200 litres, how many growers in each state hold advanced stock, why lead times run to years, and what a council pays for a street tree against a giveaway.

What Plants Cost at the Nursery in 2026
The general reference behind every article on what a garden costs: the median trade price ex GST at each pot size, the middle half around it, the spread across growers, the state premium and how it flips with size, what a farm-gate price leaves out, and worked figures for a hedge, a feature tree and a bed of ground covers.