Nursery Industry Statistics 2026, and How to Cite the Index
The two kinds of nursery industry number, the industry's own survey and the live supply picture, for Australia: growers listed by state, plants on current lists, the single-grower share, median trade prices by size, plant capitals and advanced-tree growers from the September 2026 Index, Hort Innovation's production value, and how to cite the Index, its data file and its licence.
Updated 25 September 2026. Figures from the HortOS Plant Price Index, September 2026 edition, and Hort Innovation's nursery industry statistics project (published 31 August 2026); refreshed each edition.

On this page
Anyone who searches for nursery industry statistics finds two kinds of number and rarely knows which is which. The first is the industry's own survey: how much Australia's production nurseries grow, what it is worth and who they employ, gathered once a year from a sample of businesses. The second is the live supply picture: which growers publish an availability list this month, what is on it, and what the trade pays. The idea that matters most is that the two answer different questions, that both are citable, and that a writer, a student or a library guide should say which one a figure comes from.
This page gives both for Australia. The industry figures are Hort Innovation's, from its five-year nursery industry statistics project delivered by Greenlife Industry Australia. The supply figures are the HortOS Plant Price Index, September 2026, edition 1, compiled from the published availability lists of Australian wholesale growers on HortOS, a free directory of Australian wholesale plant growers with their published availability and trade prices: growers listed by state, plants on current lists, the share held by a single grower, the median trade price at each pot size, the towns where growers cluster, the most listed plants and the growers holding advanced trees. It ends with how to cite the Index, what is in its data file, and the licence it is published under.
Quick facts
| Growers listed | 3,526 wholesale growers listed on HortOS at the September 2026 edition: New South Wales 1,244, Victoria 864, Queensland 798, Western Australia 253, South Australia 208, Tasmania 106, Northern Territory 31, ACT 17. |
|---|---|
| What is on the lists | 19,438 distinct plants on growers' current lists; 12,921 of them, 66 per cent, on one grower's list only. |
| What it costs | Median trade price ex GST: 140 mm $7.00, 200 mm $14.00, 300 mm $50.00, 400 mm $110, 45 L $120, 100 L $295, 200 L $650. |
| The industry's value | Annual production value exceeding $2 billion, from 1,435 production nursery surveys over five years (Hort Innovation, nursery industry statistics 2020-21 to 2024-25). |
| Where growers cluster | 35 growers within 12 kilometres of Dural, 32 of Monbulk, 23 of Somerville, 15 of Palmwoods. |
| How to cite | HortOS Plant Price Index, September 2026 edition, https://au.hortosapp.com/index. Tables and charts may be reproduced with attribution and a link; the data file is JSON and the page's dataset metadata declares a Creative Commons Attribution 4.0 licence. |
Two kinds of number
Hort Innovation's nursery industry statistics project ran from 2020-21 to 2024-25, delivered by Greenlife Industry Australia with Down To Earth Research and ACIL Allen, and its final report was published on 31 August 2026. Hort Innovation says it collected data from 1,435 production nursery surveys over five years, validated the results with retail nurseries and landscape businesses, and demonstrated the industry's ongoing economic importance with annual production values exceeding $2 billion. That is the number to cite for the size of the industry, and the project page and report are the place to cite it from.
The Index measures something else: not what the industry is worth but what it offers this month. It is compiled from growers' own published availability lists as they appear on HortOS, with resellers and trading platforms excluded so that a plant is counted where it is grown, and every price statistic is a median across growers from trade lists only. It is not a survey of every nursery in Australia and it is not retail pricing; it is what the wholesale trade could see, this month, if it looked at every list at once. A grower counts as listed when its page is in the directory; a plant counts when it is on a current list.
Growers listed, by state
The Index's data file gives the growers listed by state at the September 2026 edition. The counts are of wholesale production nurseries with a page in the directory, and a state's count moves as growers are added, merge or close.
| State | Growers listed | Growers holding 100 L or larger stock |
|---|---|---|
| New South Wales | 1,244 | 79 |
| Victoria | 864 | 49 |
| Queensland | 798 | 49 |
| Western Australia | 253 | 4 |
| South Australia | 208 | 5 |
| Tasmania | 106 | 2 |
| Northern Territory | 31 | 1 |
| ACT | 17 | 2 |
| Australia | 3,526 | 191 |
The second column is the Index's advanced-tree count: a grower counts once if any line on its current list is 100 litres or larger. The state hubs for New South Wales, Victoria and Queensland list the growers by town, and the street trees guide sets out what the advanced-tree growers hold and what it costs.
What is grown
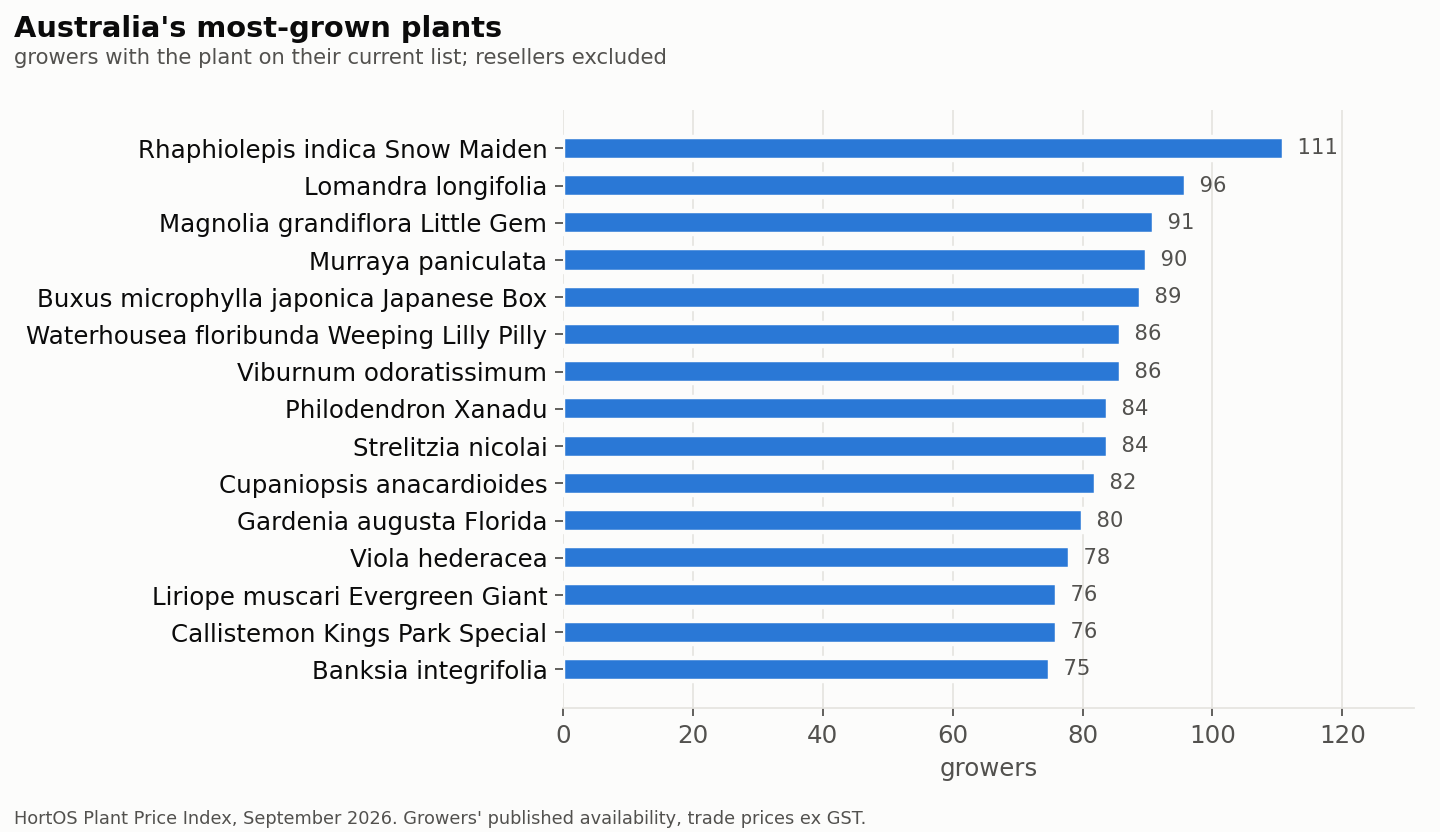
The September 2026 edition counted 19,438 distinct plants on Australian growers' current lists, of which 12,921, 66 per cent, appear on one list only: if that grower drops the line, the plant is effectively unavailable to the trade until someone else propagates it. The most listed plants were Indian hawthorn (Rhaphiolepis indica Snow Maiden) with 111 growers, spiny-headed mat rush (Lomandra longifolia) with 96, Little Gem magnolia with 91, orange jessamine (Murraya paniculata) with 90, Japanese box with 89 and weeping lilly pilly with 86. Compiled from the same lists in September 2026 and classified by species, 45 of the 100 most listed plants are Australian natives; the most grown native plants guide gives them state by state.
What it costs
The Index publishes a national median trade price ex GST at each pot size, the middle half around it and the median in Queensland, New South Wales and Victoria, one price per grower from trade lists only: 140 mm $7.00, 200 mm $14.00, 300 mm $50.00, 400 mm $110, 25 L $55.00, 45 L $120, 100 L $295 and 200 L $650 in September 2026. It also defines a price basket, the 40 most-grown lines at 200 mm and 300 mm with ten or more growers, median across growers and equal-weighted, set to 100 in September 2026 so that later editions can be read as a plant price index in the ordinary sense. The cost reference sets out the medians, the spread across growers and the state premium in full, and the price pages carry the live figure for every plant with three or more pricing growers.
Where the growers cluster
The Index draws a 12 kilometre circle around each town and counts the growers with current lists inside it. In September 2026 the plant capitals were Dural in New South Wales with 35 growers (with Kenthurst, Glenorie and Galston), Monbulk in Victoria with 32 (Silvan, Seville, Mooroolbark), Somerville in Victoria with 23 (Cranbourne South, Clyde, Baxter), Palmwoods in Queensland with 15, Elimbah in Queensland and Peats Ridge in New South Wales with 13 each, Clagiraba in Queensland with 12, Eumundi in Queensland and Alstonville in New South Wales with 11 each, and Redland Bay in Queensland with 10. The town hubs for Dural, Monbulk and Somerville list them.
How to cite the Index
The Index page asks to be cited as HortOS Plant Price Index, September 2026 edition, https://au.hortosapp.com/index, and says that tables and charts on the page may be reproduced with attribution and a link, with press-ready charts free to reproduce with the credit line left in place. Each edition is a month; cite the edition, not the site, because the figures change with each one and the current edition's page will say something different next year.
The data behind the page is a JSON file, linked from the page as the data file, at a URL that names the edition: for September 2026, au.hortosapp.com/index/2026-09/data.json. It carries the edition and compilation date, the headline counts (growers listed, growers by state, plants, single-grower plants and share), the basket definition and its lines, the median by size nationally and by state with the middle half, the price spreads, the state comparison matrix, the advanced-tree counts and species, the hedge calculator's species and spacing, the plant capitals and the most-grown list, so a researcher can reproduce any table on the page. The page's dataset metadata declares the Creative Commons Attribution 4.0 licence, whose deed says the material may be shared and adapted for any purpose, including commercially, provided appropriate credit is given, a link to the licence is provided and any changes are indicated.
Two rules for a careful citer. Quote a figure with its edition or, for a live price page, with the date it was read, because both move. And keep the Index's own limits in the sentence: it counts growers listed and plants on current lists, it never counts availability lists, it names no grower beside a price, and it does not measure the industry's turnover, which is Hort Innovation's number.
What to watch for
- Mixing the two kinds of number. Growers listed on HortOS and production nurseries surveyed by Hort Innovation are different populations counted different ways.
- Quoting without the edition. A September 2026 median is not a 2026 median; the Index is monthly.
- Reading a directory count as a census. Growers listed by state is a directory count that moves as growers are added or removed.
- Reading a median as a retail price. Every Index figure is the trade price ex GST at the farm gate.
- Adding up what is not there. The Index publishes no count of availability lists and no grower's price; a figure of that kind did not come from it.
Getting it right
- For the industry's size and employment, cite Hort Innovation's nursery industry statistics project and its final report.
- For growers by state, plants on lists, medians by size and where growers cluster, cite the HortOS Plant Price Index by edition, with a link to the page.
- For a single plant's price, cite its price page with the date it was read.
- Reproduce a table or chart with the credit line and a link, and say if you changed it.
- Read the method section on the Index page before quoting a figure it qualifies.
A word of caution
The Index figures on this page are the September 2026 edition's and the live pages change as lists arrive; the next edition will carry different numbers under the same headings. The industry value is Hort Innovation's finding, quoted from its project page, and its report is the authority on what the figure covers. Neither number is a count of businesses in the industry. A citation that names its source and its date is the only kind that survives the next edition.
Sources
- Hort Innovation, nursery industry statistics 2020-21 to 2024-25 (NY21000): production value, surveys, final report.
- Greenlife Industry Australia: the industry's peak body and the project's delivery partner.
- Creative Commons, Attribution 4.0 International deed: what the Index's licence allows.
More guides

Street Trees and Canopy: What Advanced Stock Costs and Who Holds It
The advanced-tree story from the HortOS Plant Price Index as a standing page: the trees the trade grows for streets and parks, the farm-gate median at 45, 100 and 200 litres, how many growers in each state hold advanced stock, why lead times run to years, and what a council pays for a street tree against a giveaway.
The Most Grown Native Plants in Australia, by State
A data page, not an essay: the Australian native plants held by the most wholesale growers, counted grower by grower and state by state from growers' current lists on HortOS, with the median trade price at the size most growers price. Two paragraphs on what the tables show and what they do not, then the tables, refreshed each edition.

What Plants Cost at the Nursery in 2026
The general reference behind every article on what a garden costs: the median trade price ex GST at each pot size, the middle half around it, the spread across growers, the state premium and how it flips with size, what a farm-gate price leaves out, and worked figures for a hedge, a feature tree and a bed of ground covers.